Introduction: The Apple, The Coin, and The Chaos
Understanding the shift from deterministic patterns to the reality of statistics and probability.
🍎 The Apple, The Coin, and The Chaos: Why We Need Statistics
Imagine you are Isaac Newton sitting under a tree. An apple falls. Bonk. 🍎
In that moment, the world feels simple. You can write a clean, beautiful equation to predict exactly how fast that apple falls and exactly where it lands. If you know the rules, you know the future. This is the “safe zone” of science—what we call Deterministic patterns.
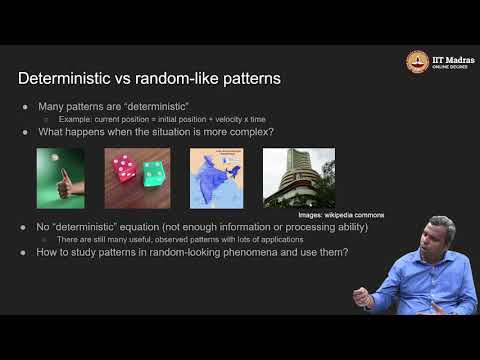
But now, imagine you are standing in the middle of the Stock Market, or looking up at the monsoon clouds over India. Can you write a simple equation for that?
The answer is no.
This is the story of the Statistics 2 course. It’s about leaving the safety of perfect equations and stepping into the messy, chaotic reality of the real world.
The Plot Twist: When Math Breaks
The lecture argues that while Newton’s laws are great for planets and apples, they fail us when things get complex.
- The Coin Toss: Theoretically, physics could predict a coin toss 🪙. But you’d need to know the wind speed, the muscle force of your thumb, and the friction of the air. It’s too much information to process.
- The Rainfall: We need to know if it will rain to plant crops 🌧️. But clouds don’t follow simple straight lines; they are unpredictable.
- The Stock Market: Millions of people buying and selling based on news, panic, and rumors 📉. No single equation can tell you if a stock will go up or down.
So, if we can’t predict exactly what will happen, do we just give up?
The Hero: The Statistical Trinity
Since we can’t be perfect, we choose to be smart. We stop looking for “certainty” and start looking for “patterns.” The lecture introduces a “Golden Triangle” that helps us navigate this chaos:
- Data: The raw evidence we collect (the rainfall logs, the stock prices).
- Probability: The theory or logic used to model chance (e.g., “There is a 70% chance of rain”).
- Statistics: The tools we use to infer things from that data.
We might not know exactly what the stock market will do tomorrow, but with Statistics, we can spot the trends hidden in the noise. We move from “This will happen” to “This is likely to happen.”
Your First Quest: The Digital Portfolio 🛡️
The lecture wraps up with a mission. It’s not just about listening; it’s about doing.
The instructor introduces a “Bonus Track”—activities worth 10% of your grade.
- The Objective: Build a Student Portfolio using Google Sites.
- The Why: To document your journey from a novice to a data detective.
- The How: You create a website (kept private for the course) that acts as your lab notebook as you learn to tame the chaos of the real world with numbers.
Between the predictable falling apple 🍎 and the chaotic stock market 📈, which type of problem do you think is harder for a computer to model, and why?
Video Overview
This video is the “Week 0” introductory lecture for the Statistics 2 course in the IIT Madras B.S. Degree Programme. The instructor explains how this course connects three major topics—Data, Statistics, and Probability—to help us understand and predict complex real-world events.
Key Concepts Explained
1. Predictable vs. Unpredictable Patterns Distinct separation between two types of scientific study:
- Deterministic (Predictable): Some things follow simple, exact rules (Newton’s laws). [07:38]
- Random/Complex (Unpredictable): Other things are too messy for simple equations (Coin tosses, Stock Market). [10:01], [13:05]
2. The Solution: Statistical Study Using a framework to find patterns in chaos:
- Data: Observations collected from the real world.
- Probability: Modeling how random things happen.
- Statistics: Analyzing data to make predictions. [19:30]
Course Activity: Creating a Portfolio
- The Task: Create a personal “Student Portfolio” website using Google Sites.
- The Tutorial: Demo on logging in, template selection, and publishing. [22:42]